
Back in 2009 we got our soil tested. We had done one of those home tests you get at the nursery but what it was telling us didn’t seem to be right. I bucked up and decided to bay the $36 to get the professional test done. Here is what it came back as:

Nearly everything except calcium, sodium, boron and chloride were high to very high, though boron and sodium were higher than they should have been. The following year we had our best harvest out of all of the years we’ve been keeping track. This pumpkin along with 4 others were grown that year from two plants. Squeak weighs 60 lbs for reference.

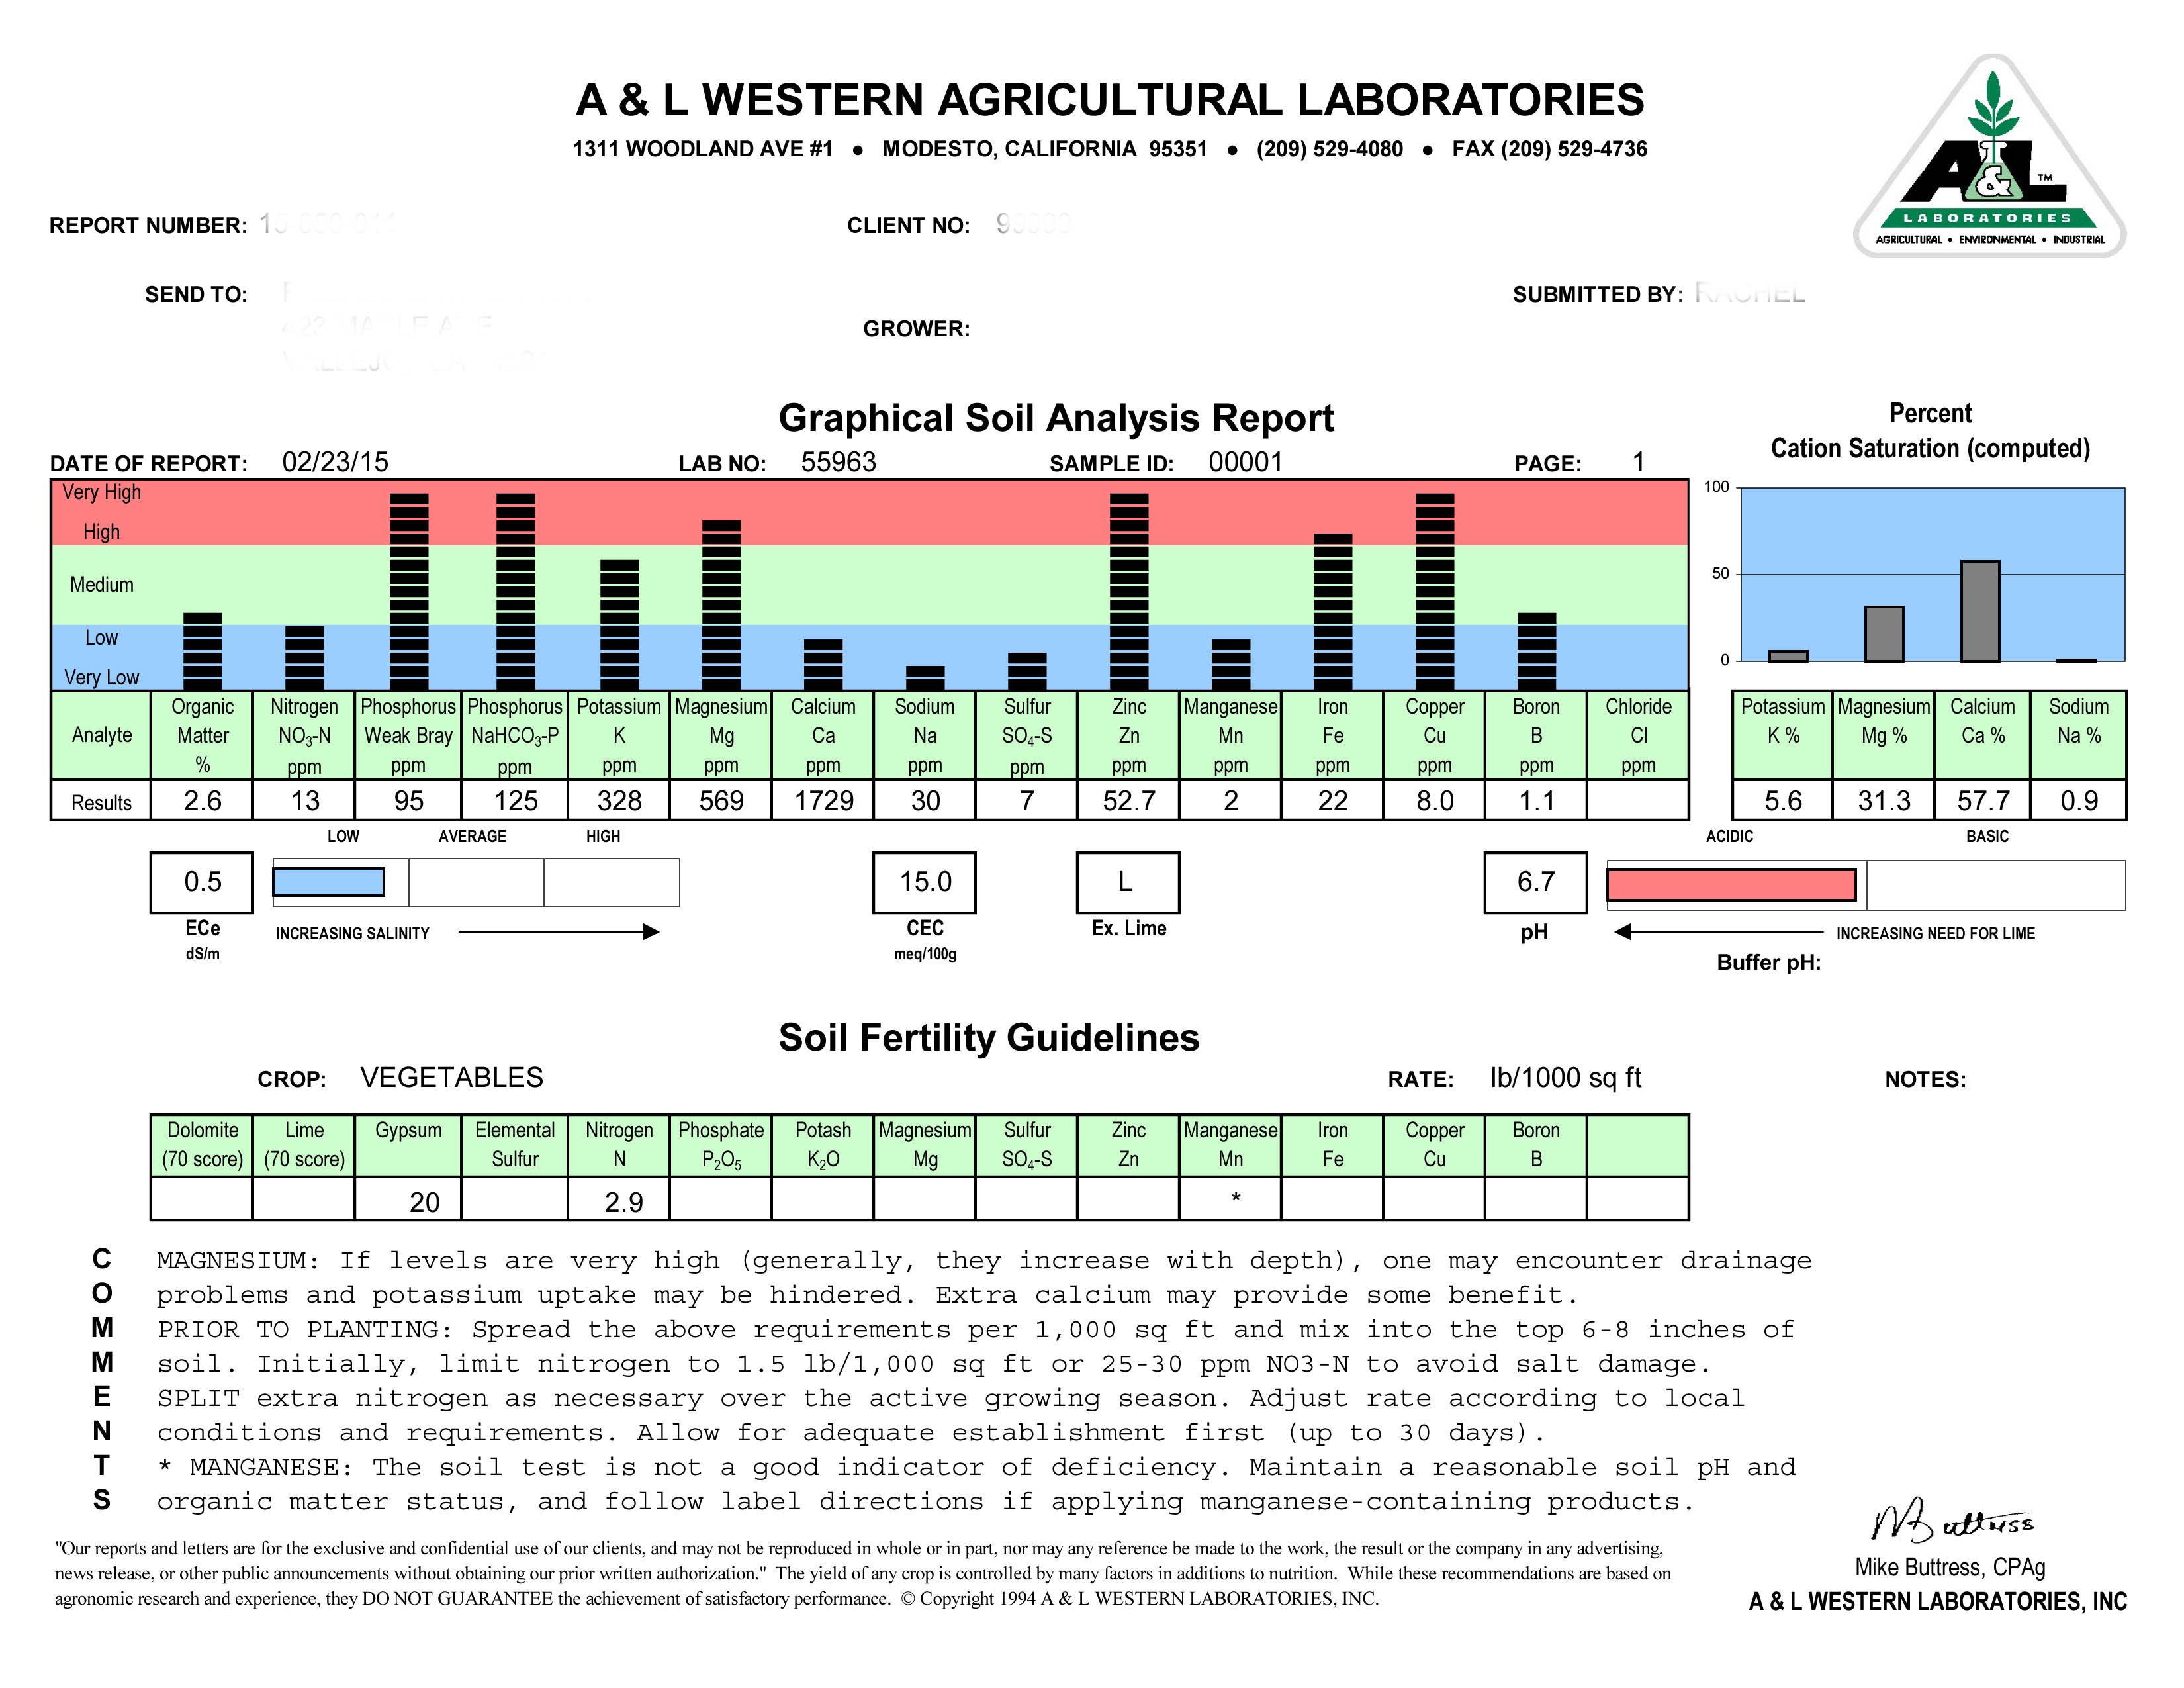
As time wore on our harvest total slowly went down. This past year our tomatoes were mediocre at best. Our squash hardly did anything. We had consistently added composted goat and chicken bedding but it clearly wasn’t doing the job. So this year we decided to run another soil test to see what was going on. Here are the results:
It’s interesting to see how the levels have changed over time.
- Phosphorus levels have gone up while magnesium, zinc and copper have remained high to very high.
- We’ve always known our copper levels were high. Our property used to be an orchard and copper is used as a fungicide for most fruit trees. Also, goats require copper in their diet and inevitably they will excrete some of it.
- Phosphorus has most likely gone up due to the chicken manure. Goat manure tends to be higher in potassium than nitrogen and phosphorus but chicken manure is highest in phosphorus. Add into that the higher phosphorus levels in the feed of chickens (grains) and the grass straw used as bedding for the goats and that would explain the higher phosphorus levels.
- Magnesium levels are most likely also due to manure application.
- Everything else has dropped substantially. Some of that is good (such as sodium and born which were both previously medium-high and are now low) but we’ll need to boost organic matter, nitrogen, calcium, sulfur and manganese.
- For as much composted bedding as we put down every year (4-6″ layer turned in) we were surprisingly low on organic matter in our soil.
- The reduction in organic matter can easily be explained. The original test was done after our yearly application of compost while this test was done before adding compost.
- The original test was taken after we used our well water to water the garden. This was how we came to find out that our well water had salt water intrusion, hence the higher salt, sodium and boron content. We’ve done a good job at leaching those salts out of the soil in the past 5 1/2 years.
- We have been lax at adding back calcium, sulfur and manganese which would explain the drop in levels.
- The pH is 6.7 which is slightly acidic, but in the most beneficial range for the best availability of major nutrients by most plant types.
- This change is most likely due to the leaching out of salts which tend to make soils more alkaline.
- Improvements need to be considered for the CEC or Cation Exchange Capacity since it has dropped 9.5 points. The CEC is your soil’s ability to hold onto and release different positively charged elements and compounds, called cations. These include Potassium, Magnesium, Calcium and Ammonium (Nitrogen).
- CEC is most likely lower due to decreased organic matter in the soil. Organic matter is negatively charged.
- We have a clay loam soil. Clay tends to have a higher CEC because clay particles are negatively charged.
- One of the reasons that it could have gone down is due to the leaching of sodium that we had to do. Sodium is also a cation.
For Part II we’ll go over what the optimum levels of nutrients are for vegetable production and how we are going to get our soil in tip top shape for the coming season. Stay tuned!

I know about improving soil because I studied that at the University I attended. #1 add compost every season to soil. # 2 use worm castings #3 I use Azomite ( volcano dust)
to soil around plants and water it in. The
best thing you can do for plants is every 12 days of growing season, spray with fish emulsion and Kelp. Besides these additives, use
peat moss to help retain water. You can improve your soil and see the growth difference of plants!